
|
As you might have already noticed, last week TopCoder posted a component design competition that involves Rational® Performance Tester (RPT) -- RPT Logging Adapter -- and, in fact, a series of more RPT component competitions are launching today. Are you ready?
This article includes a quick start to get you familiar with RPT basic concepts and workflow, as well as a section on extending RPT's out-of-the-box functionality through the use of custom Java code.
1. Overview
Rational® Performance Tester is a load and performance testing tool for web-based applications; it helps development teams validate the scalability and reliability of their on-going web applications before deployment and production. RPT allows you to capture your interactions to test your web-based applications, recording them and examining them later to measure your application's performance. You can also use RPT to further identify the root causes of poor performance issues from the hardware- or software-component level through advanced resource monitoring and response-time tracking.
Download
At IBM's website, you can download an evaluation copy of RPT. Note that you need to have an IBM ID to download it.
Installation
RPT is built on top of the Eclipse framework, so if you already have Eclipse installed in your system, you may choose to install RPT as an extension (options are available in the installation wizard). A fresh installation will have a dedicated copy of Eclipse installed as well.
2. Getting Started with Rational Performance Tester
In RPT, performance testing has five stages: test creation, test editing, workload emulation with schedules, schedule execution, and evaluation of results.
- Test Creation.
In this stage, test scenarios (Test in RPT term) will be created. Generally tests are created by recording representative interactions (generally through a web browser) with an application, these actions are saved and a test is generated from these recorded actions. One can also create tests from scratch: the custom Java code we'll discuss later is a good example. - Test Editing.
After recording a test, run it individually and inspect the results to make sure that the tests are doing what you expect. You may also want to edit your tests. Typical changes that you might make are:- Replacing a value in a recorded test with values in a datapool. This produces more realistic test data.
- Adding dynamic data to a test (referred to as data correlation).
- Enabling verification points, so that you can determine whether an expected behavior occurred.
- Workload Emulation with Schedules.
A schedule can be seen as the "engine" that runs tests. This can be as simple as one virtual user running one test, or as complicated as hundreds of virtual users, in different groups, each running different tests at different times.
With a schedule, you can:- Group tests to emulate the actions of different users (with User Groups).
- Set the order in which tests run: sequentially, randomly, or in a weighted order.
- Set the number of times each test runs.
- Run tests at a certain rate.
A typical schedule contains the following:
- User groups and tests. A schedule requires at least these items to run.
- Items, such as loops, delays, and setting behavior of the think time, to further, better and more accurately emulate a load.
- Schedule Execution.
The created schedules could be executed on demand. - Evaluation of Results.
Reports are displayed during and after the schedule execution. You can also regenerate reports after the execution, customize reports, and export reports in HTML format, so that others who do not have RPT can see them. Those reports help you make your evaluation and determine the root causes of poor performance.
Case Study: Struts MailReader Demo Application
Now let's go through a step-by-step case study that covers the abovementioned stages. This demonstration is based on the MailReader Demo Application shipped with Apache Struts 1.3.8, a simple application that maintains email information of registered users. In this case study, we will test performance of both viewing pages and editing the email information.
Prerequisites
(1) Deploy struts-faces-example2-1.3.8.war to Tomcat or another container.
(2) Visit the deployed application, register a user with username "test" and password "test".
Test Plan
Let's assume a scenario like this:
- There are two groups of users, one group who just views the web pages (viewing group, 70% of all users) while the other group edits their email information (editing group, 30% of all users).
- In the scenario, each group will perform their operations 20 times: the viewing group performs 5 operations per minute, while the editing group performs 4 operations per minute.
- Create a "Performance Test Project".
Launch RPT, click File > New > Performance Test Project, enter project name "RPTTest1" and select the location, then click Finish to create the project.
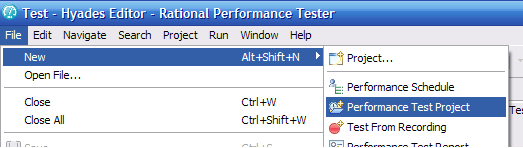
Fig 2.1 Create project
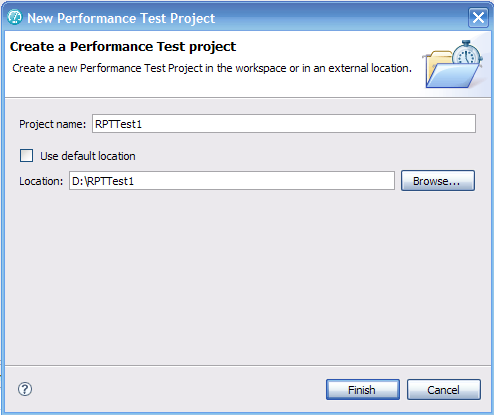
Fig 2.2 Enter project name and location
- Record Tests
Click File > New > Test from Recording, choose HTTP Recording in the dialog, click Next, enter the test name "View", and click Finish.
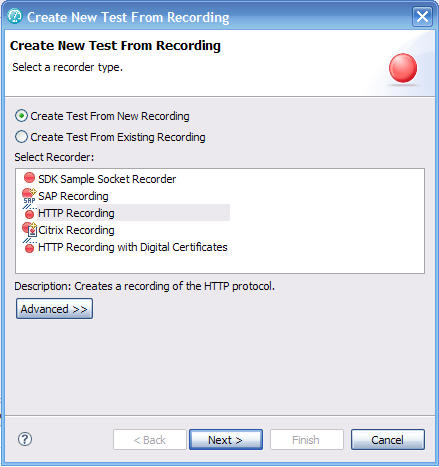
Fig 2.3 Start an HTTP Recording
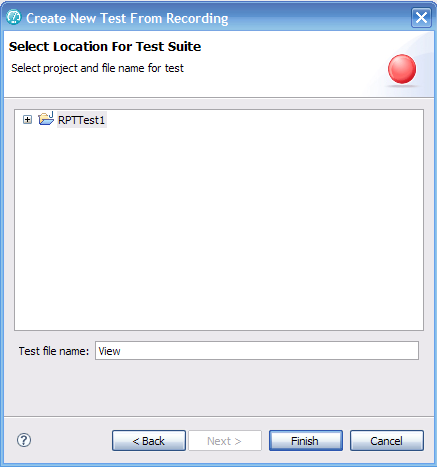
Fig 2.4 Enter Test Name
Now your browser will be launched, through which you'll start to interact with your application. Enter the address of your deployed MailReader Demo Application to begin. Note that if the application is deployed on the same machine as RPT, make sure not to use "localhost" or "127.0.0.1" as the host name -- by default, connections to local addresses will not pass through the RPT proxy, so you should simply bind an IP address with your application container.
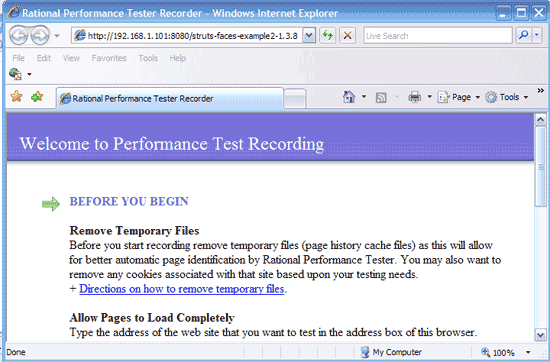
Fig 2.5 Initial Web Page of HTTP Recording
Log onto the application with username "test" and password "test", then logout and exit the browser.
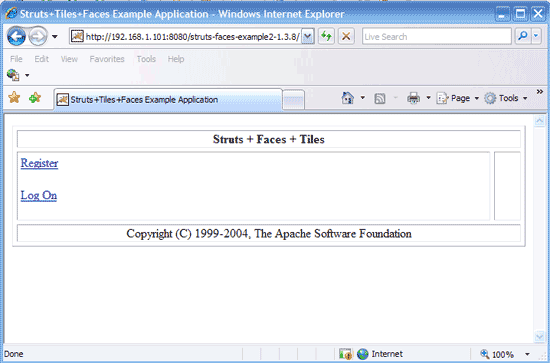
Fig 2.6 Homepage of MailReader Demo Application
Now your will see a test named "View" in Test Navigator view.
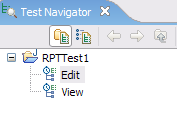
Fig 2.7 Created Tests
We also need to create a test named "Edit," using similar steps, whose testing interactions will include logging on, editing email addresses and logging out. - Execute Tests and Make Changes
Now you can execute the created tests by right-clicking them and selecting Run As > Performance Test to see if the tests behave as expected. You can make changes to the tests as necessary. - Create Performance Schedule
Right-click the project, and then click New > Performance Schedule, enter the schedule name "Schedule" in the dialog, and click Finish.
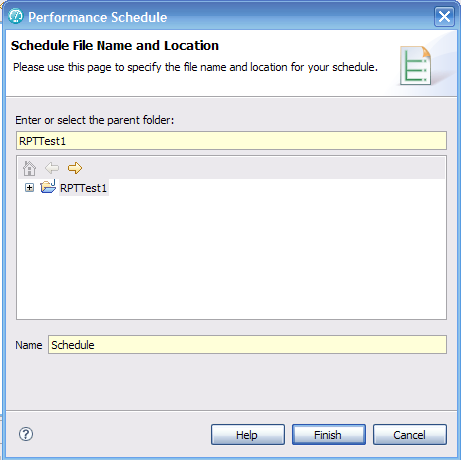
Fig 2.8 Create Performance Schedule
A new schedule is displayed with one user group. Since we need two user groups, right-click the schedule, then click Add > User Group to add another group.
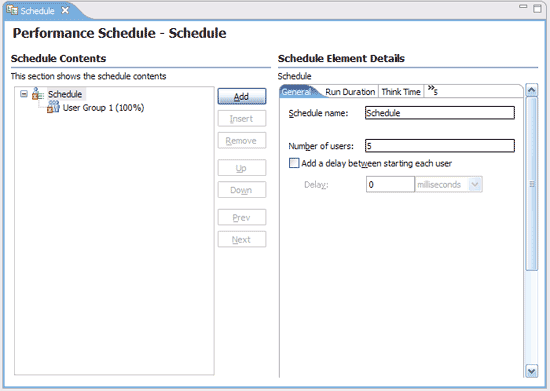
Fig 2.9 Newly Created Schedule
Change the Group Size of "User Group 1" to 70%, right-click it, then click Add > Loop to add a loop to the user group. Change the iteration number of the loop to 20, check "Control the rate of iterations", and change the rate to 5 per minute. Right-click the loop, then click Add > Test, then choose test "View" to add the test to the current loop.
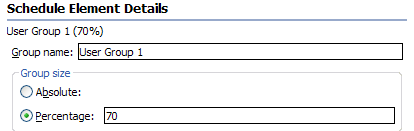
Fig 2.10 Adjust Properties of User Group
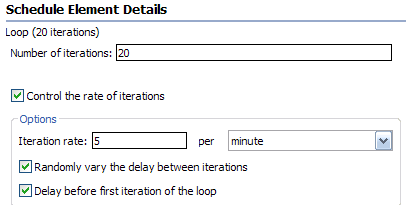
Fig 2.11 Adjust Properties of Loop
Adjust "User Group 2" similarly and finally save the project. Now we have successfully created a schedule. - Execute Test Schedule
Right-click the Schedule, and then click Run As > Performance Schedule. Now the schedule will be executed. - Check Reports
Once the schedule execution completes, reports will be generated automatically. There are various performance counters grouped as "Page Performance", "Response vs. Time", "Page Throughput", etc. By analyzing the reports, you can make the performance evaluations as well as locate the performance bottleneck.
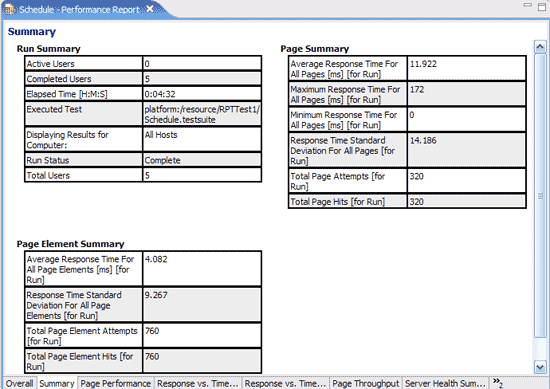
Fig 2.12 Summary of Schedule Execution
3. Custom Java Code in RPT - Extending the out-of-box functionalities
Like its foundation Eclipse, extensions are welcome by RPT. Basically you can extend how you run your tests by writing custom Java code and calling the code from the test, you can also specify that results from the tests that are affected by your custom code be included in reports.
Custom code enables you to perform such tasks as managing loops, retrieving virtual user information, running external programs from tests, and customizing data correlation.
For example, the test execution could be extended in the following ways:
- Store objects in data areas that contain objects for engine, virtual user, test, and HTTP information.
- Manage the behavior of loops.(See Case Study #2)
- Retrieve the IP address of a virtual user.
- Perform custom data correlation.
- Run a batch file or program that sets up the environment needed for a test and resets the environment afterward.
Test Execution Services
The essential extension support of RPT comes from Test Execution Services (TES), which includes a number of interfaces and classes defined in the com.ibm.rational.test.lt.kernel and its sub-packages.
Important interfaces and classes are briefly described in the following table, for more details please refer to the TES API reference shipped with the RPT documentation.
| Interface/Class | Description |
| ICustomCode2 | Defines customized Java code for test execution services. Use this interface to create all custom code. |
| ITestExecutionServices | Provides information for adding custom test execution features to tests. This interface is the primary interface for execution services. ITestExecutionServices provides access points to the following interfaces: IDataArea, IARM, ILoopControl, IPDLogManager, IStatisticsManager, ITestLogManager, ITime, and ITransaction. |
| IDataArea | Defines methods for storing and accessing objects in data areas. A data area is a container that holds objects. The elements of a data area are similar to program variables and are scoped to the owning container. To use objects specific to a protocol, you should use objects provided by that protocol that are stored in the protocol-specific data area. |
| ILoopControl | Provides control over loops in a test or schedule. For example, you can use this interface to break loops at specific points in a test. The loop that is affected is the nearest containing loop found in either the test or the schedule. |
| IPDLogManager | Provides logging information such as problem severity, location levels, and error messages. |
| IStatisticsManager | Provides access to statistical counters in the ICustomCode2 interface (used for defining custom code). Statistical counters are stored in a hierarchy of counters. Periodically, all the counter values in the hierarchy are reported to the performance testing workbench and collected into performance test run results, where they are available for use in reports and graphs. Each counter in the hierarchy has a type (defined in class StatType). The operations that are available on a counter depend on the counter's type. |
| ITestLogManager | Logs messages and verification points to the test log. Use this interface for handling error conditions, anomalies in expected data or other abstract conditions that need to be reported to users, or for comparisons or verifications whose outcome is reported to the test log. ITestLogManager can also convey informational or status messages after the completion of a test. |
| ITestInfo | Provides information about the test that is running; for example, the test name and information about the current problem determination log level for this test. |
| IVirtualUserInfo | Provides information about virtual users; for example, the virtual user's name, problem determination log level, TestLog level, globally unique ID, and user group name. |
| IStatistics | Retrieves the statistics counter tree associated with the current statistics processor. Stops the delivery of statistical counters. Changes the priority of the statistics deliver thread. |
ICustomCode2
There's only one method defined in interface ICustomCode2, which will be called by the test engine while executing the tests:
public String exec(ITestExecutionService tes, String[] args);
Parameter tes is provided by RPT test engine, and used by custom Java code to interact with TES. Parameter args is provided through references or field references, which must be included in the tests; within the tests, the references must precede the code that they affect.
Steps to Create Your Custom Code
The following are typical steps to create custom code:
- Open a test and select a test element to which the custom code will be added.
- Click Add or Insert and then select Custom Code to add the custom code.
- Change the class name as you like.
- Add arguments (i.e. args parameter in ICustomCode2.exec method) through references.
Case Study #1: Log JVM Heap Size
In this case study, we'll create custom code to log the maximum JVM heap size. Though it is not very useful here, we're just using this to demonstrate how to create a simple piece of custom code inside a test element.
- Create a Performance Test Project with name "RPTTest2".
- Create an empty test element.
Select project "RPTTest2", click New > Test Element.
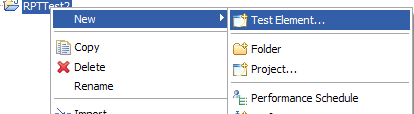
Fig 3.1 Create a Test Element
Select New HTTP Test in the dialog, click Next.
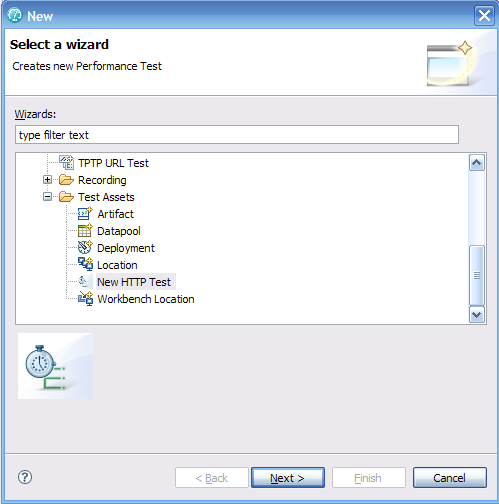
Fig 3.2 Select New HTTP Test
Enter test name "Test1", click Next, then enter description, click Next, then change "Number of HTTP pages to generate" to 0 and click Finish.
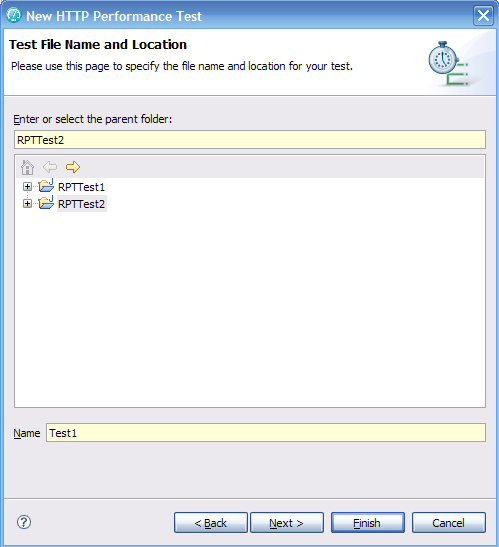
Fig 3.3 Enter test name
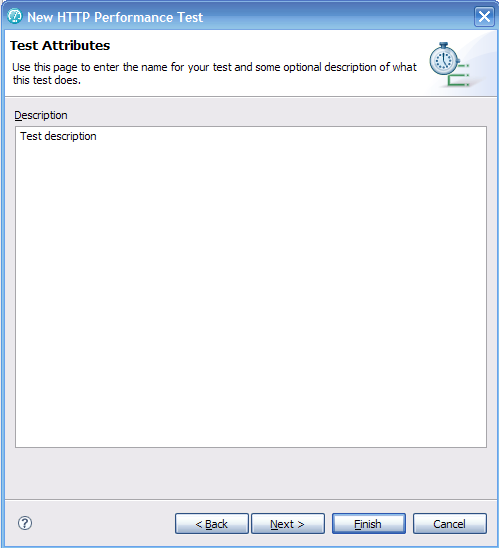
Fig 3.4 Enter test description
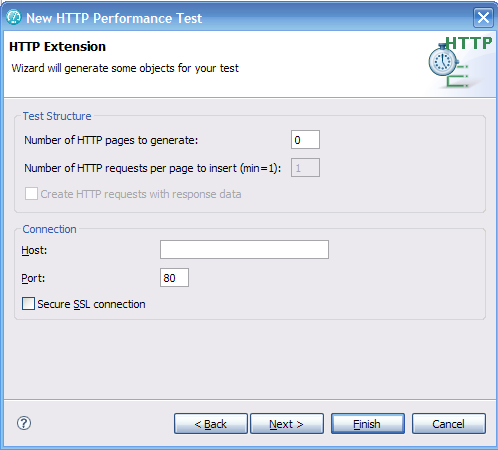
Fig 3.5 Change the pages number
- Create custom code
Now test "Test1" will be shown in the test editor, right-click it and select Add > Custom Code, a Custom Code test element will be added, change its class name to "test.JVMInfo".
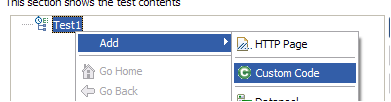
Fig 3.6 Add Custom Code
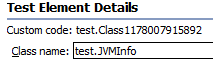
Fig 3.6(a) Change class name
Click Generate Code, then Java source editor will be opened with the generated stub class that implements ICustomCode2 interface.
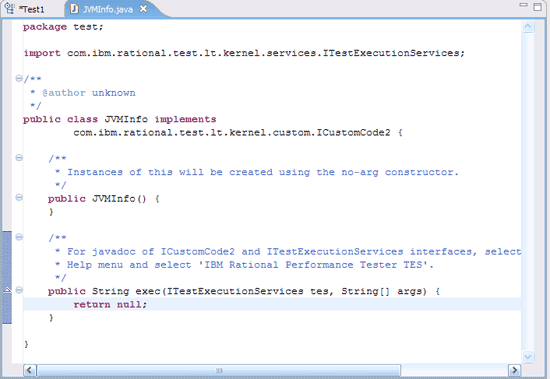
Fig 3.7 Custom code stub class
Edit source code of exec method to this:
public String exec(ITestExecutionServices tes, String[] args) { // Get JVM runtime Runtime rt = Runtime.getRuntime(); // Get JVM heap size in MB long maxMB = rt.maxMemory() / (1024 * 1024); String hostName = "Unknown"; // Get host name try { hostName = InetAddress.getLocalHost().getHostName(); } catch (UnknownHostExcept8ion e1) { tes.getTestLogManager().reportMessage("Can't get hostname"); return null; } // Log the JVM heap size tes.getTestLogManager().reportMessage("JVM maximum heap size for host " + hostName + " is " + maxMB + " MB"); return null; } - Execute the test with custom code
Execute test "Test1" by right-clicking it, then clicking Run As > Performance Test. - Check test log
In the "Performance Test Runs" view, test runs are logged, right-click the run you want to check, select "Display Test Log" to see the test logs.
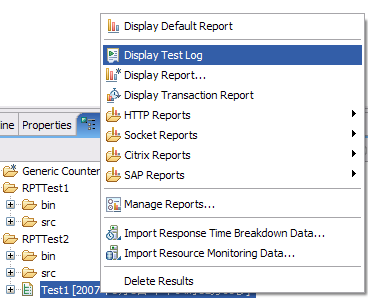
Fig 3.8 Display Test Log
In the log, you can see a message with JVM heap information was logged.
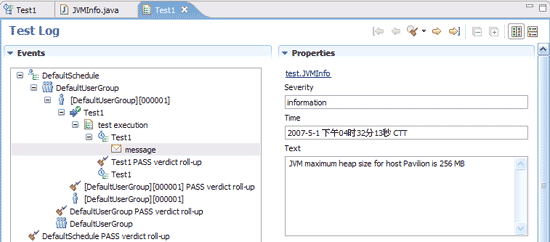
Fig 3.9 Logged message for JVM heap
Case Study #2: Loop Controlling
In this case study, we'll go back to the "Edit" test that was recorded in Section 2. We'll add all the interactions in "Edit" to a 10 times loop, and then use custom code to control the loop -- the loop will be broken if the user name shown in editing page is not as expected. With this case study, you'll familiar yourself with various TES interfaces.
- Record a test "Edit"
Repeat steps in MailReader Demo case study to record the test "Edit". - Add interactions of "Edit" to a loop
Select all interactions (test elements) inside "Edit", right-click them, and select Insert > Loop. Change "Number of iterations" of the loop to 10.
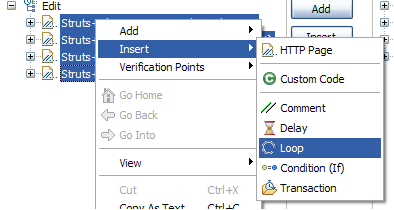
Fig 3.10 Add test elements of "Edit" to a loop
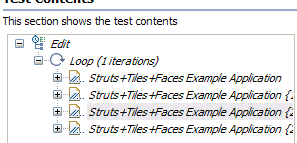
Fig 3.11 Adjusted test "Edit"
- Add 3 pieces of custom code to the loop, with the names "test.Initialize", "test.UsernameCheck" and "test.LoopCheck" respectively. Use Up/Down buttons to adjust their positions as depicted in Fig 3.12.
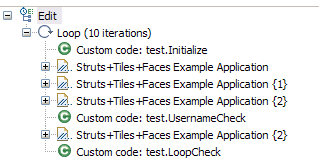
Fig 3.12 Loop with custom code
- Edit custom code test.Initialize
Method exec of test.Initialize would be:
public String exec(ITestExecutionServices tes, String[] args) { // Get the test's data area and set a flag indicating that nothing // has failed yet. This flag will be used later to break out // of the loop as soon as a failure is encountered. IDataArea dataArea = tes.findDataArea(IDataArea.TEST); dataArea.put("failed", "false"); return null; } - Edit custom code test.UsernameCheck
Method exec of test.UsernameCheck would be:
public String exec(ITestExecutionServices tes, String[] args) {
    // Check if the username is the expected
    if (args[0].equals("test")) {
        // user name is correct
        tes.getTestLogManager().reportMessage("User name correct");
    } else {
    // user name is incorrect, log a message and set failure flag
    tes.getTestLogManager().reportMessage("User name incorrect");
        IDataArea dataArea = tes.findDataArea(IDataArea.TEST);
            dataArea.put("failed", "true");
    }
    return null;
}
Then we need to add a reference to the argument indicating username (args[0] in the code), the argument will come from the editing page:
- Select test element "test.UsernameCheck", and click Add in the Arguments field.
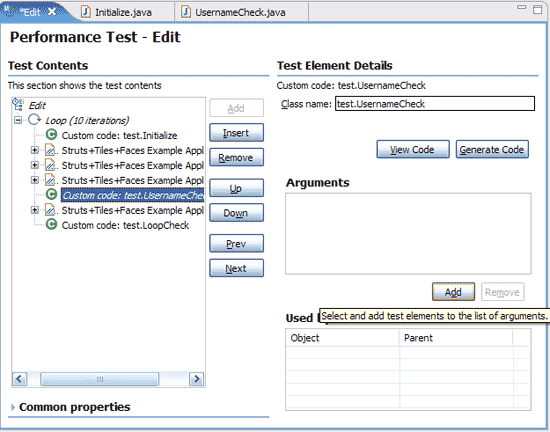
Fig 3.13 Add argument reference
- Select the "test" in editing page and click OK.
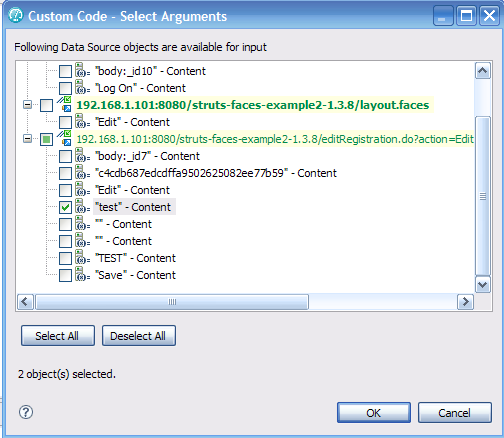
Fig 3.14 Select argument reference
- Select test element "test.UsernameCheck", and click Add in the Arguments field.
- Edit custom code test.LoopCheck
Method exec of test.LoopCheck would be:
public String exec(ITestExecutionServices tes, String[] args) { // exit the loop if failure flag is true IDataArea dataArea = tes.findDataArea(IDataArea.TEST); String flag = (String) dataArea.get("failed"); if ("true".equals(flag)) { // break the loop tes.getLoopControl().breakLoop(); } return null; } - Execute the test
Execute the test "Edit" by right-clicking it, then selecting Run As > Performance Test. - Check test log
Check the test log of "Edit" run. The log will indicate that 10 iterations were all executed, and a message "User name correct" was logged for each iteration.
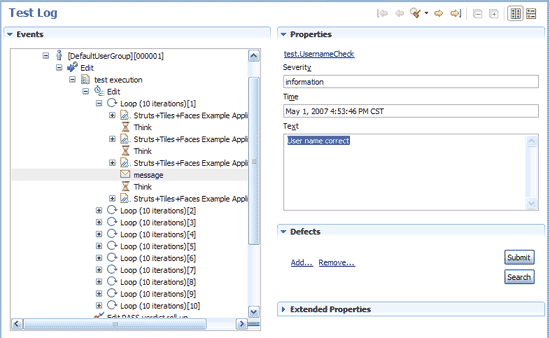
Fig 3.15 Test log of "Edit" run
The loop was not interrupted because "test" was always used to log onto the application, thus the condition arg[0].equals("test") was always met. If we change the condition to arg[0].equals("test1"), then only one iteration would be executed and a message "Username incorrect" would be logged.
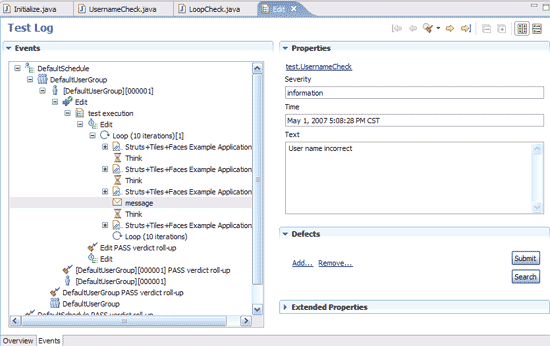
Fig 3.16 Test log of an interrupted loop
Download the files for these two case studies.
4. Resources
It is impossible to cover all of the aspects of RPT in such a short article. If you'd like to dig deeper, check out the resources below.
- RPT Official Documentation
Official Documentation is the best references we have for RPT, after installing RPT, you can find it through Help > Help Contents. - Performance testing tutorials
Official tutorials shipped with RPT, you can find it through Help > Tutorials Gallery > Watch and Learn > Test a Web application. - Performance testing samples
Official samples shipped with RPT, you can find it through Help > Samples Gallery > Technology sample > Performance Testing Plants by WebSphere. - Hello World: Learn how to discover and analyze performance issues using Rational Performance Tester
- Introduction to IBM Rational Performance Tester V7.0
- Handling test data with IBM Rational Performance Tester 7.0: Part 1: Using datapools for test data
- Handling test data with IBM Rational Performance Tester 7.0: Part 2: Using files for very large sets of test data
Finally, good luck in your RPT series competitions!