Challenge Overview
Challenge Overview
The goal of the challenge is to create the HTML prototype based on the provided storyboard design and requirements outlined under Challenge Requirements section.
Challenge Requirements
You are addressing the following pages and functionality in this challenge :
Login Page
-
Screenshots :
-
User login redirects to Dashboard page.
-
Both username and password fields are required.
-
Add validation.
-
Error styling should match 00_2_login.png
-
-
“Forgot Password?” link to Forgot Password page.
-
“Request Access” is dead link.
-
User can logout by using popup when clicking on user in the header as shown in (05d_manage_users.png)
Forgot Password Page
-
No screenshots.
-
This page should follow same layout and styling as Login Page.
-
Title of form should be “Forgot Password” instead of “Log In”
-
The form will include one field for username.
-
The field is required. Add validation.
-
Error styling should match the Login page error styling.
-
-
Button should be “Submit” instead of “Log In”
-
“Forgot Password?” link should be renamed “Log In” and take user to Login Page.
-
Keep “Request Access” link.
Dashboard Page
-
Screenshots :
-
The background color should match the one in 003.png
-
Top widget that has “Tumalow Headquarter Widget” title :
-
The map image circle is just an image not an actual map.
-
By default the widget looks like as this in 002.png
-
When notification received it will be updated to look like this 001.png
-
Notification div will be binded and rendered via AngularJS.
-
Add “dismiss” link to right corner of the Notification to dismiss it.
-
-
-
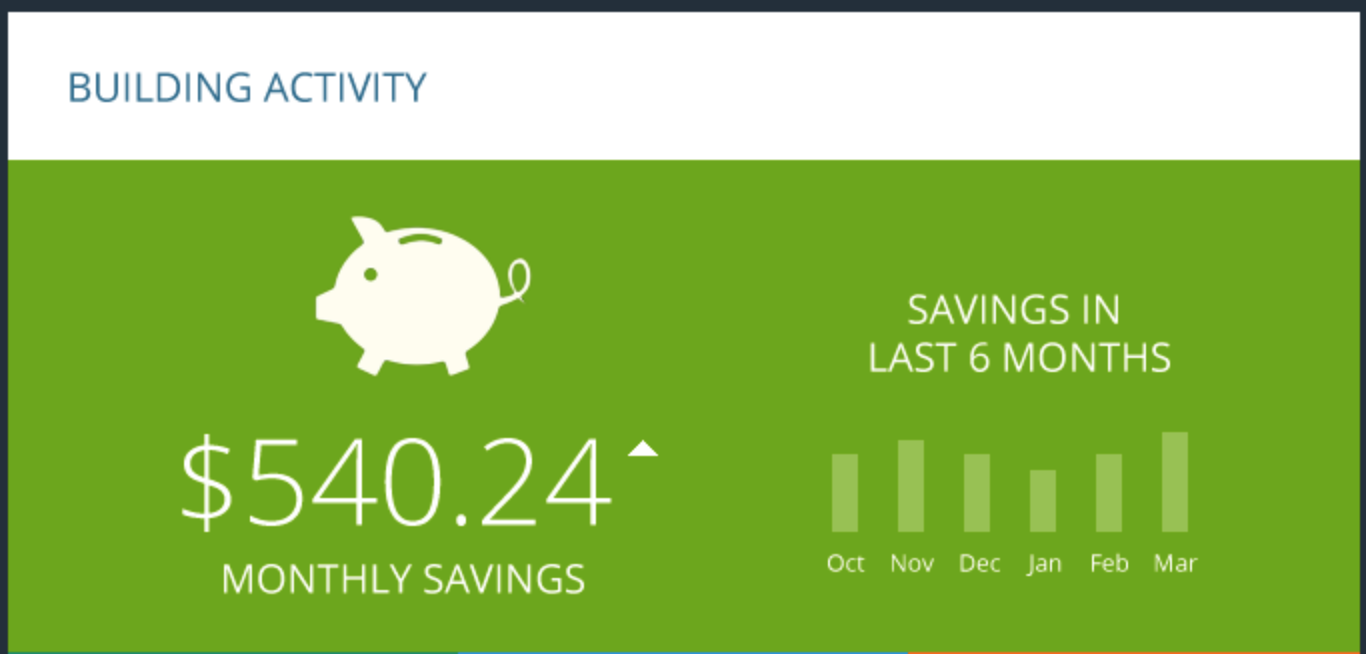
Building Activity Widget :
-
It has 5 main data that are set using AngularJS dynamically and on real time :
-
Monthly Saving $$ value.
-
The up arrow is also can be toggled to down array via angularjs. Provide an image for the down arrow and may be a case where the arrow get flipped.
-
-
Savings In Last 6 Months
-
This is column bar chart.
-
Hovering over the bar/column should show tooltip, the tooltip will display a dollar amount value.
-
Clicking on a month’s bar (eg: March) should take you to the Monthly Reports Page on the correct year/month.
-
-
The three dial charts are google charts :
-
The charts will be populated and rendered via AngularJS.
-
You will use google gauge charts with dummy data.
-
-
-
-
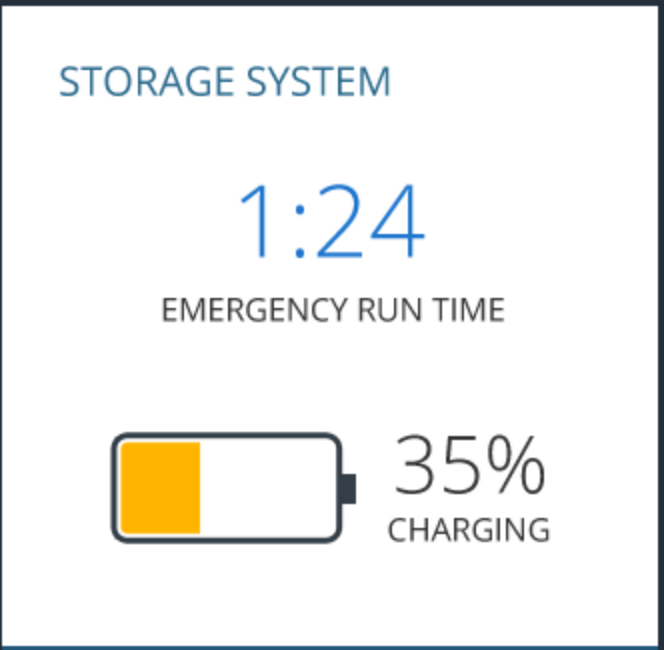
Storage System Widget :
-
The Clock digits, the state of charge % and battery are updated via angularjs dynamically.
-
The orange bar in the Battery should be animated when the bar value decreased or increased. Implement a simulation to show this feature.
-
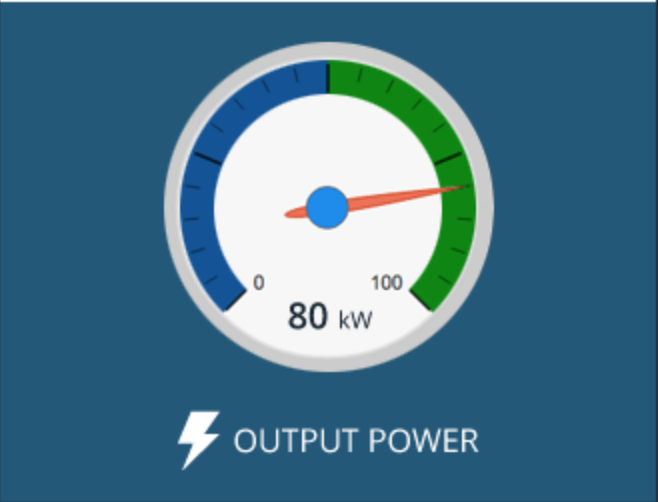
Output power widget section :
-
This is google guage chart.
-
The chart will be populated and rendered via AngularJS.
-
Use overlays if the “kw” cannot be added using the gauge chart default configurations.
-
-
-
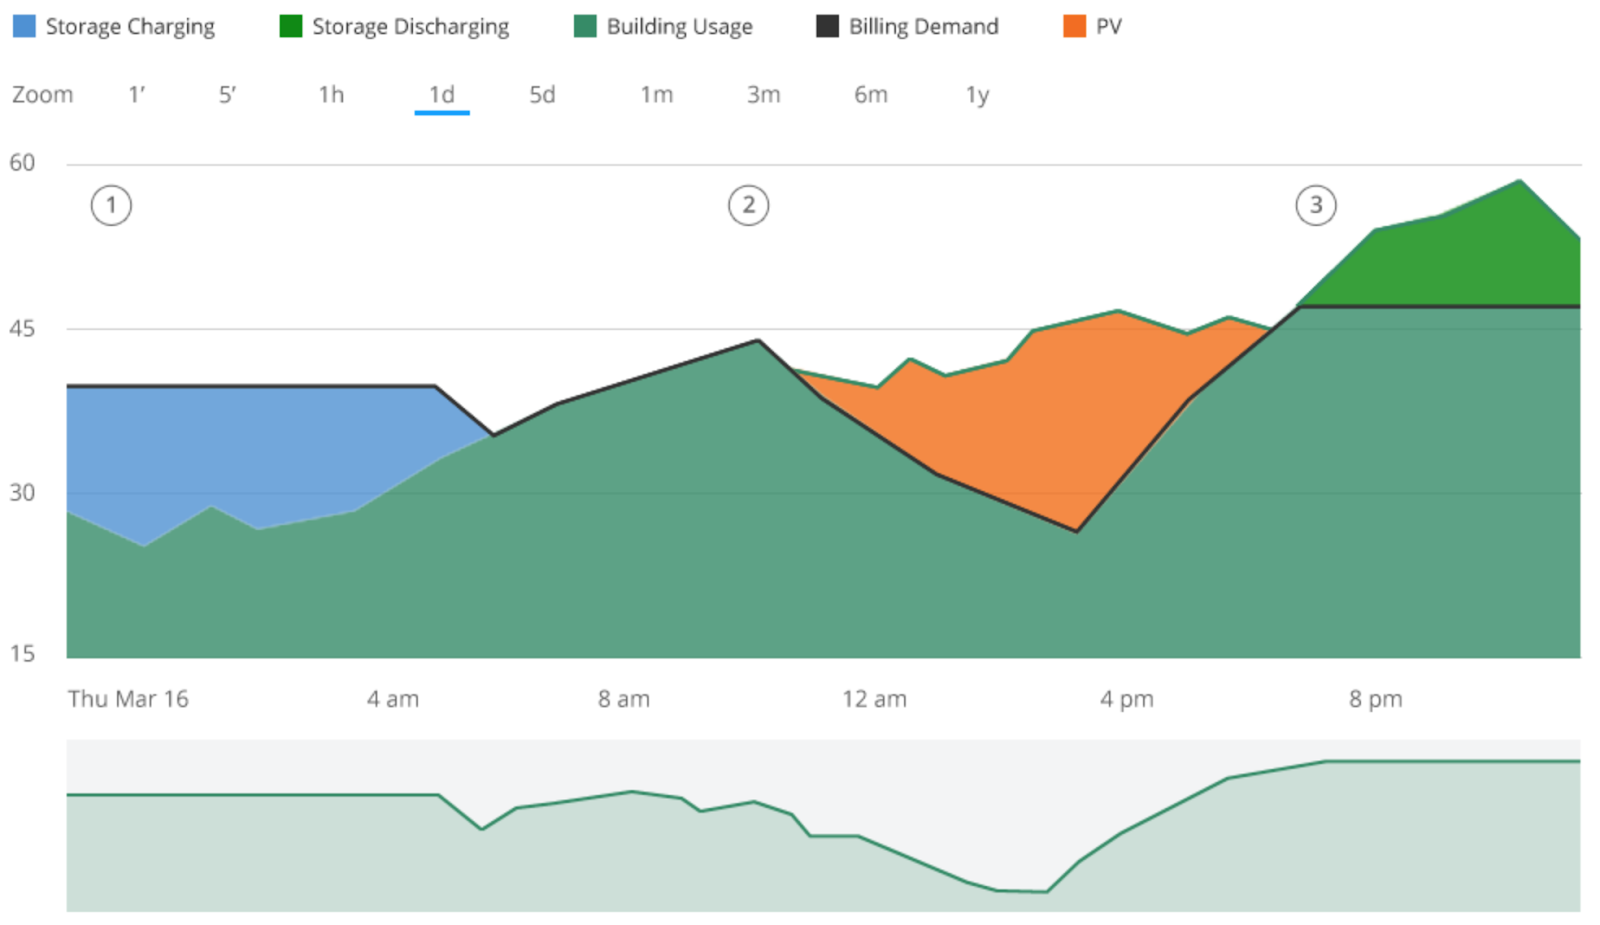
Stacked Area Chart widget (at the bottom) :
-
It is a Google Stacked Area chart.
-
The chart will be populated and rendered via AngularJS.
-
The (1), (2), and (3) icons are annotations to be added. Refer to google chart documentation for more information about displaying and customizing the annotations.
-
Safety and Notification column list will be populated via AngularJS.
-


Detailed Usage Page
-
Screenshots :
-
The top chart is identical to the Stacked Area Chart widget rendered in “Dashboard” page.
-
It is a Google Stacked Area chart.
-
The chart will be populated and rendered via AngularJS.
-
The (1), (2), and (3) icons can be added using overlays.
-
The Zoom options above the chart will affect the chart zooming. You can find more information about zooming under configuration options.
-
-
The 4 charts below the top chart are also Google Area Chart :
-
The charts will be populated and rendered via AngularJS.
-
The right side div “Kw” values are populated via AngularJS.
-

Monthly Reports Page
-
Screenshots :
-
“January 2015” in the “Monthly Report” header is a pick list.
-
Print icon at the bottom should be functional, the produced page to be printed must match the screenshot.
-
All values in the page are populated via AngularJS.
Manage Users Page
-
Screenshots :
-
Table content will be populated via AngularJS
-
Clicking on user Photo, or name will take user to User Profile Page.
-
Email column value will be linked to “Mailto:”
-
Clicking “Edit” icon will take user to User Profile Page.
-
Clicking “Delete” icon will display alert pop up (05b_manage_users.png) and will remove user from list.
-
Clicking “(+) New User” will open up New User form in user profile page (05c_manage_users.png)
-
Search User will filter users in the table. The text entered will try to match any data in any columns in the table.
-
Implement pagination.
User Profile Page
-
Screenshots :
-
Content will be populated via AngularJS.
-
Clicking Edit will change fields to be editable as in 05c_manage_users.png
-
Change photo should allow user to upload photo. Upload should show progress bar in the user photo with upload progress.
-
Navigation
-
Navigation between pages will be handled via AngularJS.
-
Notice we have two headers versions. One for Admin and the other for Non-Admin users.
-
User can logout by clicking on the username link in header as in (05d_manage_users.png)
Browser Compatibility
-
IE9+
-
Latest Google Chrome (Windows & Mac OS)
-
Latest Safari (Windows & Mac OS)
-
Latest Firefox (Windows & Mac OS)
HTML5
-
Provide comments on the page elements to give clear explanation of the code usage. The goal is to help future developers understand the code.
-
Please use clean INDENTATION for all HTML code so future developers can follow the code.
-
All HTML code naming should not have any conflicts or errors.
-
Element and Attribute names should be in lowercase and use a "-" or camel naming to separate multiple-word classes (i.e.. "main-content", or "mainContent)
-
Use semantically correct tags- use H tags for headers, etc. Use strong and em tags instead of bold and italic tags.
-
No inline CSS styles- all styles must be placed in an external stylesheet.
-
Validate your code- reviewers may accept minor validation errors, but please comment your reason for any validation errors. Use the validators listed in the scorecard.
CSS3
-
You are allowed to use Bootstrap for this challenge.
-
Provide comments on the CSS code. We need CSS comments to give a clear explanation of the code usage. The goal is to help future developers understand the code.
-
Please use clean INDENTATION for all CSS so developers can follow the code.
-
All CSS naming should not have any conflicts.
-
As possible use CSS3 style when create all styling.
-
Use CSS to space out objects, not clear/transparent images (GIFs or PNGs) and use proper structural CSS to lay out your page.
-
Only use table tags for tables of data/information and not for page layout.
Javascript
-
You MUST use AngularJS in this challenge.
-
All bindings, navigation, data populating will be via AngularJS.
-
Data for charts should be loaded from JSON files.
-
-
All JavaScript must not have a copyright by a third party. You are encouraged to use your own scripts, or scripts that are free, publicly available and do not have copyright statements or author recognition requirements anywhere in the code.
Images
-
Images should be properly compressed while still having good visual quality.
-
Please use best practice repetition usage of background based image.
- Please use sprites when using icons for your submission.
Final Submission Guidelines
Submission Guidelines
A complete list of deliverables can be viewed in the UI Prototype Competitions Tutorial.